or many years, the predictors of the future
have envisioned the concept of the paperless office wherein all correspondence and
corporate records are stored online and all paper reporting has been eliminated. Reality,
however, has shown that hard-copy reports continue to be required at an ever-increasing
rate.
Oracle Reports is the Developer/2000 tool that has been provided to
produce reports of data in the Oracle database. These reports can be previewed on the user
screen before being printed or can be printed directly. Optionally, report output may also
be saved in a file to be used at a later date.
The Oracle Reports Environment
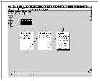
Oracle Reports operates in a Graphical User Interface (GUI) environment
such as Microsoft Windows. Functions may be performed by clicking iconic buttons or via
menu picks. The menus used by Reports dynamically change based on the current context of
the tool and are fairly intuitive as to their specific purpose. The Oracle Reports
Designer interface consists of three primary components or tools
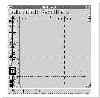
The Data Model Editor
 The Data Model Editor is
used to define all of the data elements that are to be included in the report. These data
elements are queries, links, and miscellaneous columns that are organized into sets called
groups. The Data Model Editor is operated using a set of iconic buttons that can be
selected with the mouse.
The Data Model Editor is
used to define all of the data elements that are to be included in the report. These data
elements are queries, links, and miscellaneous columns that are organized into sets called
groups. The Data Model Editor is operated using a set of iconic buttons that can be
selected with the mouse.
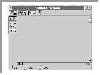
The Layout Editor
 The Layout Editor is used
to construct the format for the report. The editor presents each of the layout elements
exactly as it will appear on the final report. Like the Data Model Editor, the Layout
Editor is controlled through a set of iconic buttons as well as from the menus. The
buttons along the left side of the editor window are used to manipulate the layout
objects.
The Layout Editor is used
to construct the format for the report. The editor presents each of the layout elements
exactly as it will appear on the final report. Like the Data Model Editor, the Layout
Editor is controlled through a set of iconic buttons as well as from the menus. The
buttons along the left side of the editor window are used to manipulate the layout
objects.
Initializing the Reports Environment
 Before you develop any
reports, the development environment should be set up based on the individual preferences
as well as any standards defined by the programming organization. Use the menu pick Tools
| Options to present the Tools Options dialog Box.
Before you develop any
reports, the development environment should be set up based on the individual preferences
as well as any standards defined by the programming organization. Use the menu pick Tools
| Options to present the Tools Options dialog Box.
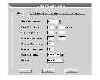
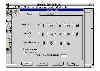
The preferences tab is used to set the specific user preferences for
the developer. These options define the parameters used by the reports designer. The first
checkbox is used to disable PL/SQL compilation. Typically, Oracle Reports compiles each
PL/SQL program unit it is closed. When you disable compilation, all program units will be
compiled when the report is generated.
The Color Palette Mode is used to define how color palettes should be
handled in Oracle Reports. The options for the list box are Editable, Read Only - Shared,
and Read Only - Private. Editable means that the color palette of the active report will
replace the system color palette causing the active report to be shown accurately while
the appearance of any inactive reports may not be accurate.
Creating a Report
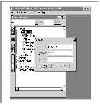 To create a new report,
either select File | New | Report from the menu or type Ctrl+E. This will create a report
named "Untitled" in the Object Navigator. After the report is created, its
properties should be defined using the Tools | Properties menu selection. The Report
Properties Dialog Box defines the dimensions for the report. The first selection in this
form is for the unit of measure for the report.
To create a new report,
either select File | New | Report from the menu or type Ctrl+E. This will create a report
named "Untitled" in the Object Navigator. After the report is created, its
properties should be defined using the Tools | Properties menu selection. The Report
Properties Dialog Box defines the dimensions for the report. The first selection in this
form is for the unit of measure for the report.
Creating a Master-Detail Report
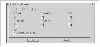
 The Master-Detail report is
a report that organizes the data according to specific break groups Break groups are
present in the Data Model Editor as separate boxes containing the data columns belonging
to the individual break group.
The Master-Detail report is
a report that organizes the data according to specific break groups Break groups are
present in the Data Model Editor as separate boxes containing the data columns belonging
to the individual break group.
Constructing a Tabular Report
 The first and most basic
report that can be developed using Reports is the tabular report. The tabular report
appears as a columnar listing of the selected rows. To build this report, create a new
report using the menu pick File | New | Report. This will create a new report called
"Untitled" in the Object Navigator. After setting the development environment
open the Data Model Editor using the Tools | Data Model Editor menu pick.
The first and most basic
report that can be developed using Reports is the tabular report. The tabular report
appears as a columnar listing of the selected rows. To build this report, create a new
report using the menu pick File | New | Report. This will create a new report called
"Untitled" in the Object Navigator. After setting the development environment
open the Data Model Editor using the Tools | Data Model Editor menu pick.
Customizing Reports with Boilerplate Text and Graphics
 The reports that have been
explored in this chapter thus far utilize the powerful, intelligent default capabilities
of Oracle Reports. Many times, however, it becomes necessary to enhance the report with
explanatory text and graphical objects.
The reports that have been
explored in this chapter thus far utilize the powerful, intelligent default capabilities
of Oracle Reports. Many times, however, it becomes necessary to enhance the report with
explanatory text and graphical objects.
Summary Column Box
The important field needed for report is the subtotal, which is
calculated as the sum of all the item totals. To create this column, use the Summary
Column tool. Double-click the desire column to display the Summary Column dialog box.
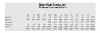
The Mailing Label Report
 The mailing label report is
used to print address labels on special paper, which is usually perforated to print labels
for multiple address records. To build this report, create a new report with the proper
page size for the label paper. In the Data Model Editor, create a simple query from the
any table ‘table name’. After the query has been created, select the Default
Layout tool, select mailing label as the report type, delete all column headings in the
Data Selection tab, and then click the OK button. The label will be formatted with all the
fields within the label.
The mailing label report is
used to print address labels on special paper, which is usually perforated to print labels
for multiple address records. To build this report, create a new report with the proper
page size for the label paper. In the Data Model Editor, create a simple query from the
any table ‘table name’. After the query has been created, select the Default
Layout tool, select mailing label as the report type, delete all column headings in the
Data Selection tab, and then click the OK button. The label will be formatted with all the
fields within the label.
The Form Letter Report
The form letter report applies database data to a specific text format.
After the query has been entered, select Form Letter style from the Default Layout tool
and click the OK button. The field boxes that appear within the report frame are hidden
when the report is run. The values in the fields can be displayed using the &fieldname
lexical parameter embedded in the text of the letter.
The Matrix Report
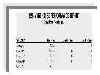
 A matrix report appears
like a columnar report, except that the column headings are retrieved as part of the
database query. This report groups the data horizontally, based on the values in the
matrix columns. In cases where no data exists the column will appear as blank unless the
developer specifies a default value if the field is null.
A matrix report appears
like a columnar report, except that the column headings are retrieved as part of the
database query. This report groups the data horizontally, based on the values in the
matrix columns. In cases where no data exists the column will appear as blank unless the
developer specifies a default value if the field is null.
Creating Dynamic Report
There are certain techniques for producing reports that define their
queries based on runtime selections by the operator. This feature can be used through
dynamic query parameters for runtime modification of a query with lexical constructs.
Using Dynamic Query Parameters
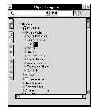 The developer can define a
user parameter for a report that defines the query. To accomplish this, open the
filename.rdf document report that was created earlier. Select the User Parameters heading
in the Object Navigator and create a new user parameter using the Add Object tool at the
left of the Object Navigator window. The new user parameter will appear under the User
Parameters heading. Double-click the icon to the left of this parameter to display the
properties sheet for the parameter.
The developer can define a
user parameter for a report that defines the query. To accomplish this, open the
filename.rdf document report that was created earlier. Select the User Parameters heading
in the Object Navigator and create a new user parameter using the Add Object tool at the
left of the Object Navigator window. The new user parameter will appear under the User
Parameters heading. Double-click the icon to the left of this parameter to display the
properties sheet for the parameter.
Ten Top Tips for Oracle Reports
Oracle Reports is a powerful tool that can be used to generate useful
reports against Oracle databases. While there are no hard and fast rules regarding how the
tool should be used, experience has borne out a number of useful tips that make a
developer's utilization of this tool much easier:


